In Q4 2022, a 1[%] increase in the share of generation from RES in the mix resulted in a 0.487[%] reduction in energy price. On average, between 2018 and 2022, a 1[%] increase in the share of generation from RES in the mix resulted in a 0.229[%] reduction in the price of energy. For several […]
In Q4 2022, a 1[%] increase in the share of generation from RES in the mix resulted in a 0.487[%] reduction in energy price. On average, between 2018 and 2022, a 1[%] increase in the share of generation from RES in the mix resulted in a 0.229[%] reduction in the price of energy.
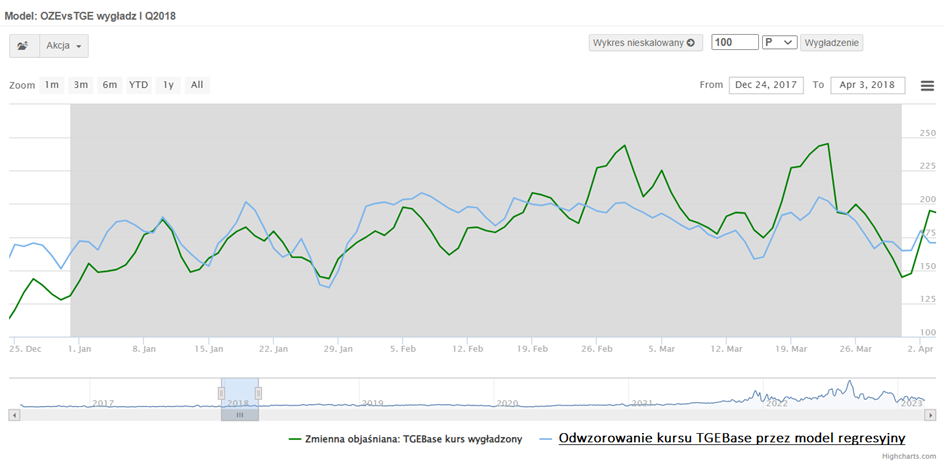
For several years, we can observe an increase in the share of RES in the Polish energy mix. Since mid-2021, this trend has accelerated significantly, and the impact of RES on the price of energy is increasing. The increase in the share of RES in the mix supports declines in energy prices. The strength of RES linkages to the TGEBase price in each quarter of 2018 – 2022 was determined using econometric models on the ExMetrix platform.
The higher the share of RES in the energy mix , the greater its impact on the price of energy:
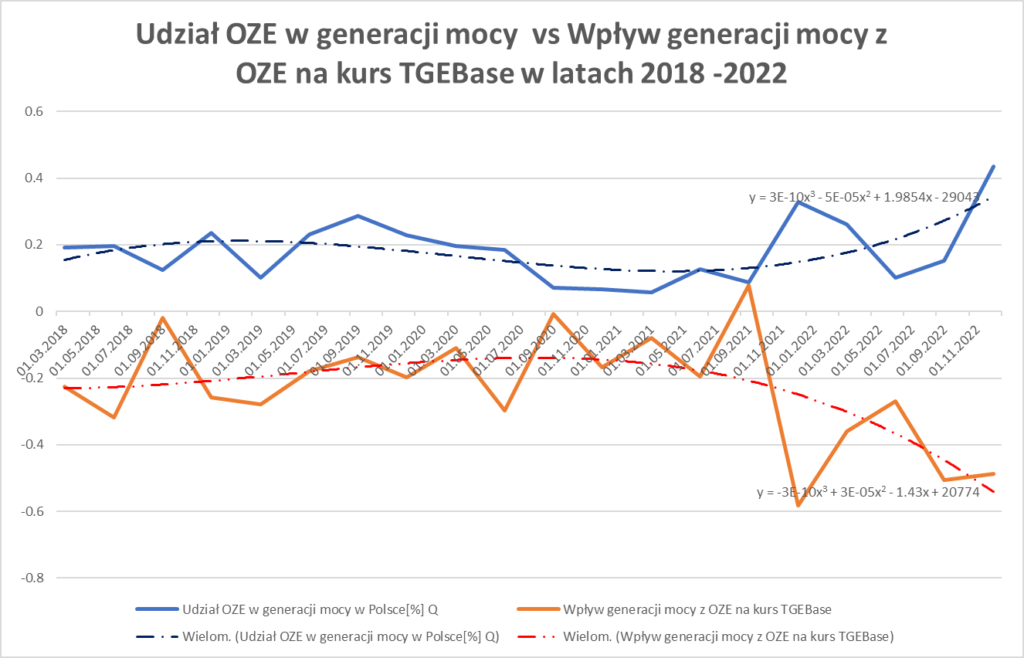
Intuitively, increasing the share of RES in the mix supports declines in electricity prices. This is due to a reduction in the cost of power generation.
Data on the share of RES in the mix at the end of each quarter in 2018- 2022:
| Date | Udział OZE w generacji mocy w Polsce *100[%] | Wpływ generacji mocy z OZE na kurs TGEBase | Generacja mocy z OZE wygładzona | TGEBase kurs wygładzony |
| 2018-03-31 | 0.191858066 | -0.225540242 | 2948.389467 | 144.7798488 |
| 2018-06-30 | 0.19549446 | -0.318670828 | 1978.349155 | 198.6439156 |
| 2018-09-30 | 0.124099006 | -0.020236382 | 2713.233422 | 243.8668184 |
| 2018-12-31 | 0.234897886 | -0.258419264 | 3890.430656 | 169.6139381 |
| 2019-03-31 | 0.100296196 | -0.278943223 | 3268.868942 | 194.8210269 |
| 2019-06-30 | 0.230405258 | -0.178045422 | 2595.76404 | 221.7712786 |
| 2019-09-30 | 0.286901255 | -0.137264747 | 2691.120143 | 236.3584433 |
| 2019-12-31 | 0.227755736 | -0.19744456 | 3315.937009 | 143.5389847 |
| 2020-03-31 | 0.196757812 | -0.110429925 | 3418.730919 | 140.9425871 |
| 2020-06-30 | 0.183858996 | -0.29727624 | 1806.881886 | 231.9758732 |
| 2020-09-30 | 0.072007076 | -0.007975035 | 2073.395739 | 245.3071397 |
| 2020-12-31 | 0.065954 | -0.166709908 | 1127.29325 | 212.1282877 |
| 2021-03-31 | 0.056978186 | -0.080369107 | 1653.76469 | 237.3864647 |
| 2021-06-30 | 0.126960089 | -0.195039553 | 1486.432388 | 386.2138248 |
| 2021-09-30 | 0.087279988 | 0.07803333 | 2639.536556 | 425.4540631 |
| 2021-12-31 | 0.328036782 | -0.58124956 | 4173.204754 | 443.0652469 |
| 2022-03-31 | 0.262307996 | -0.36088638 | 4800.582689 | 496.1301886 |
| 2022-06-30 | 0.100965647 | -0.269804534 | 2138.302712 | 1132.285331 |
| 2022-09-30 | 0.151268591 | -0.50516867 | 3927.997017 | 546.070845 |
| 2022-12-31 | 0.434441314 | -0.487542396 | 4855.225054 | 484.404742 |
In Q4 2022, a 1[%] increase in the share of generation from RES in the mix resulted in a 0.487542396[%] reduction in the price of energy.
Models linking RES power generation to the TGEBase rate by a quarter in 2018 – 2022 – ExMetrix platform.
The model response tells how much [%] the TGEBase price will change when the RES share in the energy mix increases by 1[%].
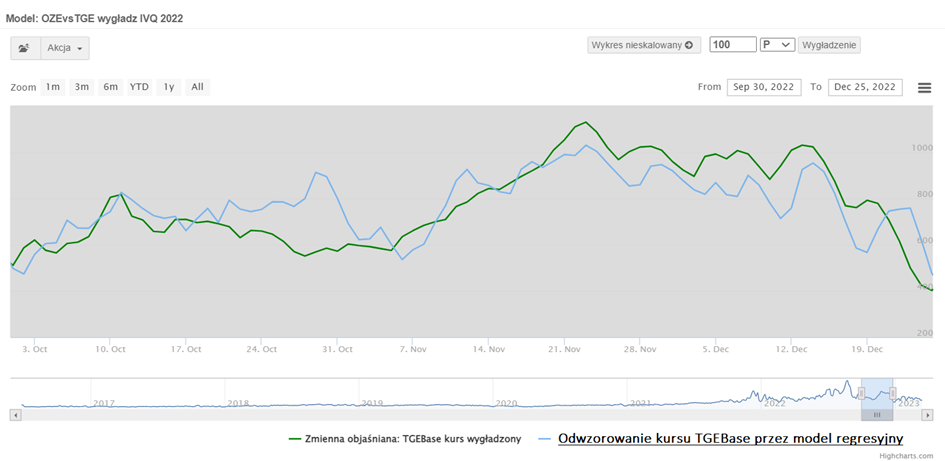
Model response: -0.48754239608883604
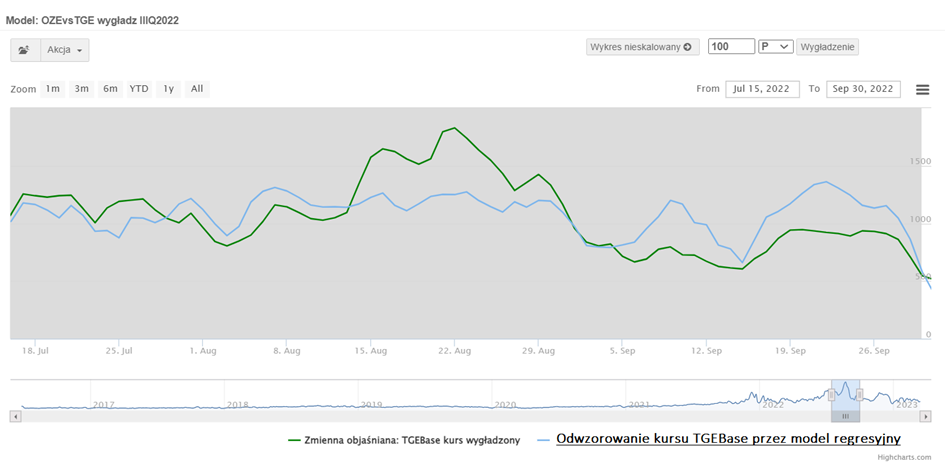
Model response: -0.5051686697901533
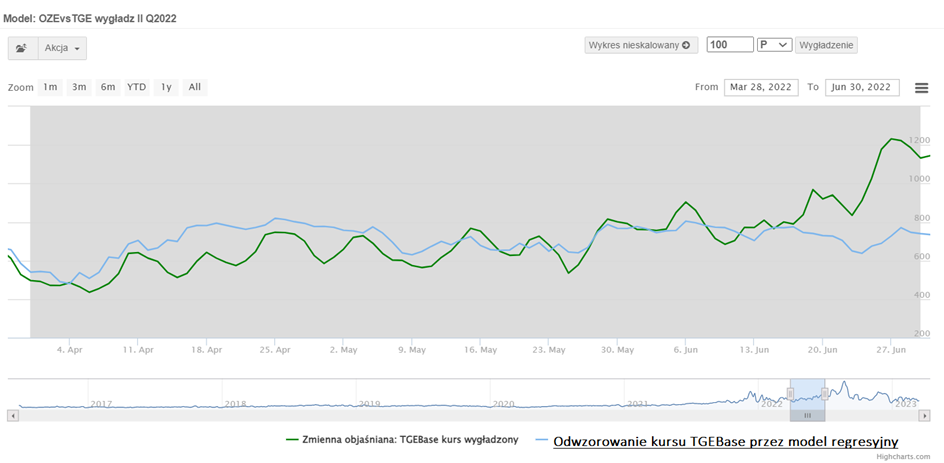
Model response: -0.26980453359286716
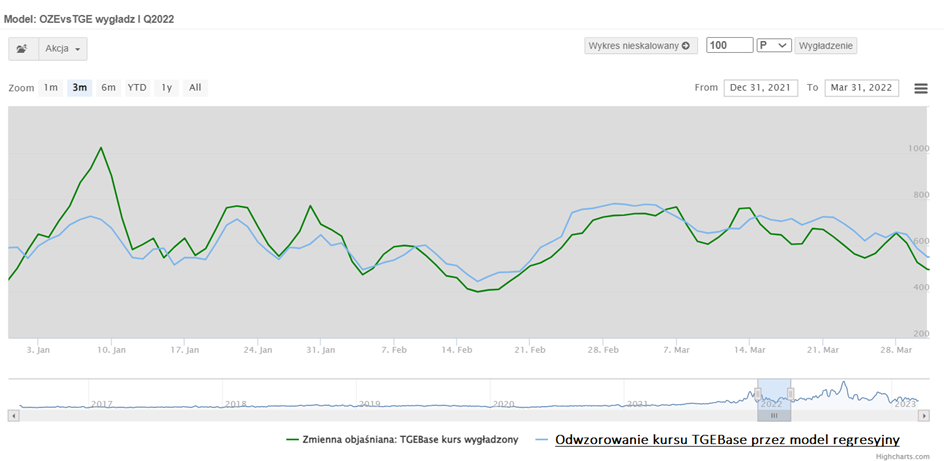
Model response: -0.3608863803586506
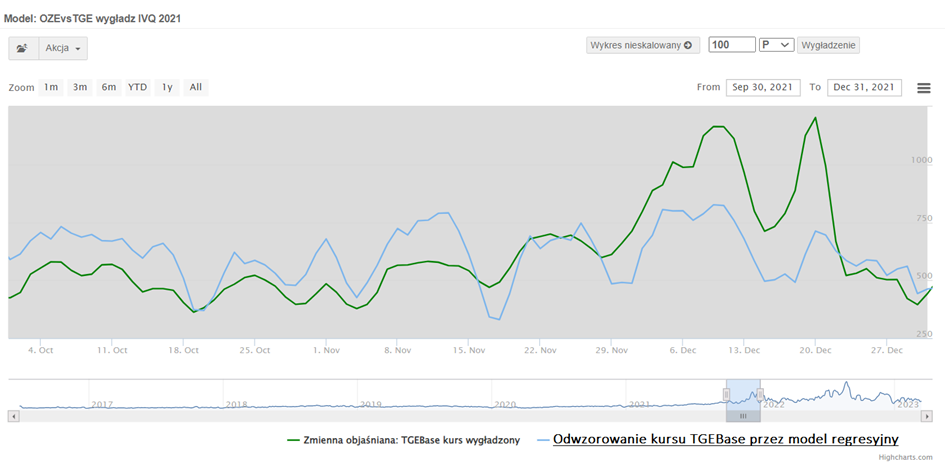
Model response: -0.5812495600580934
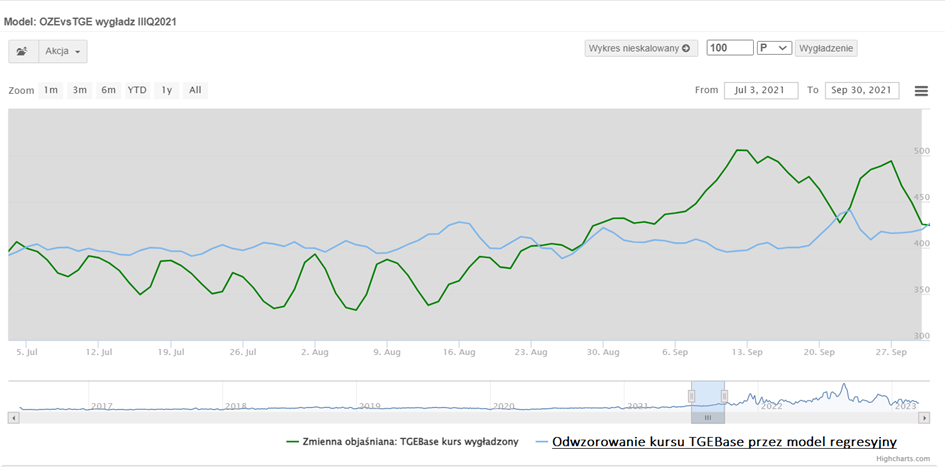
Model response: 0.07803333047741723
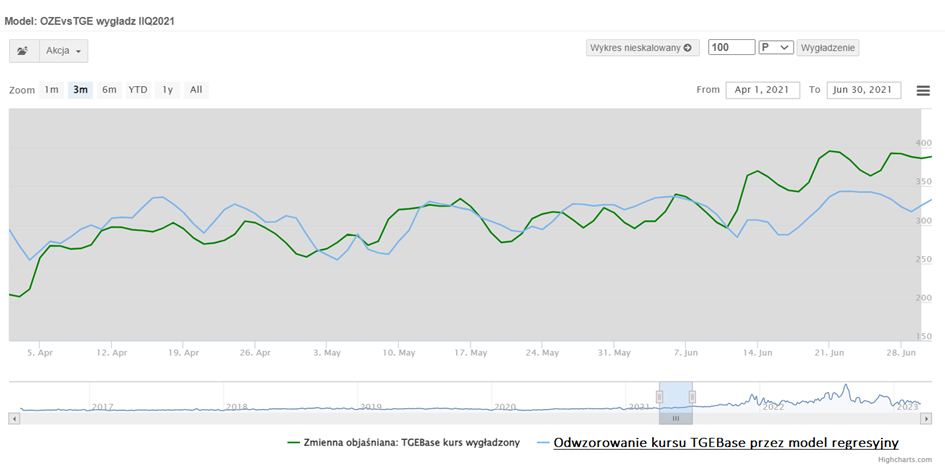
Model response: -0.1950395527578805
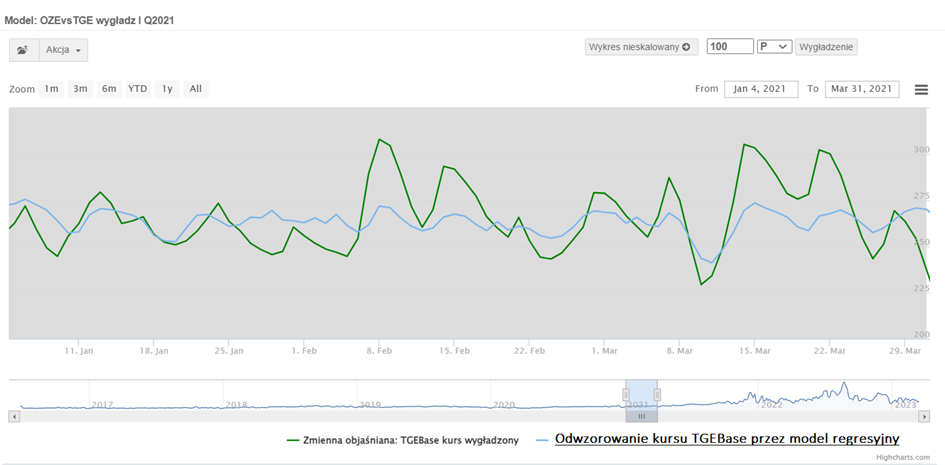
Model response: -0.08036910659245924
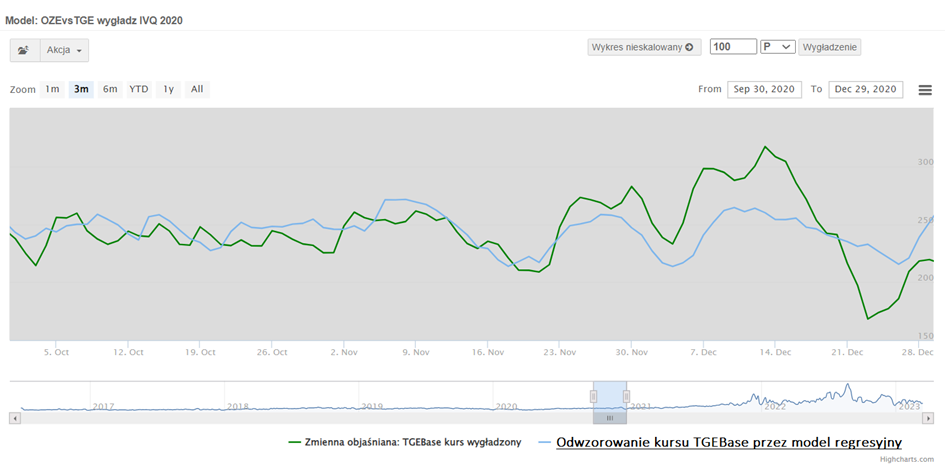
Model response: -0.16670990783109355
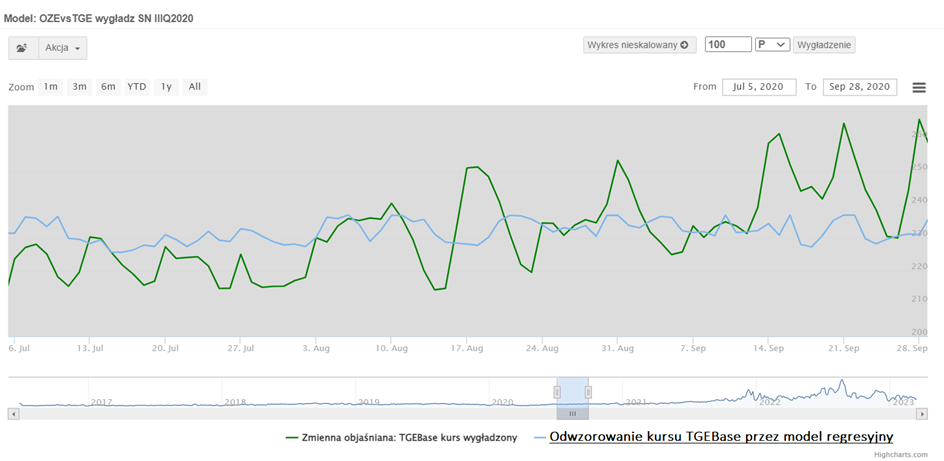
Model response: – 0.007975034900462292
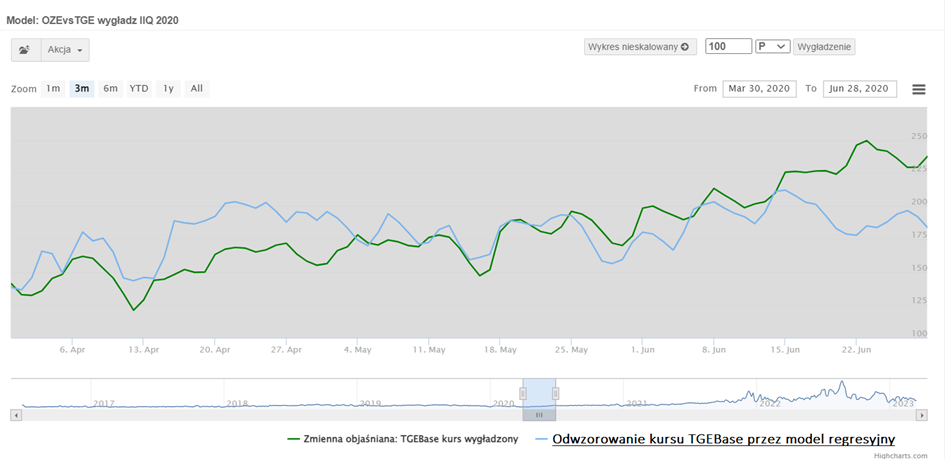
Model response: -0.29727623951564247
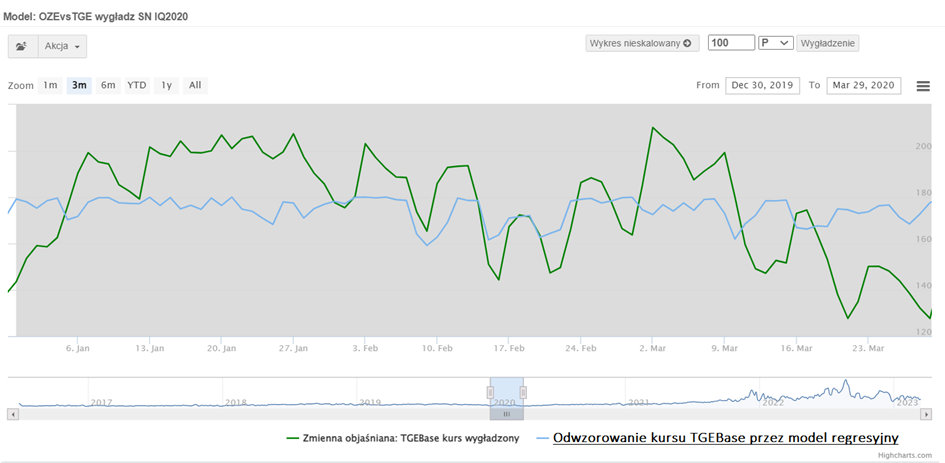
Model response: -0.11042992490071295
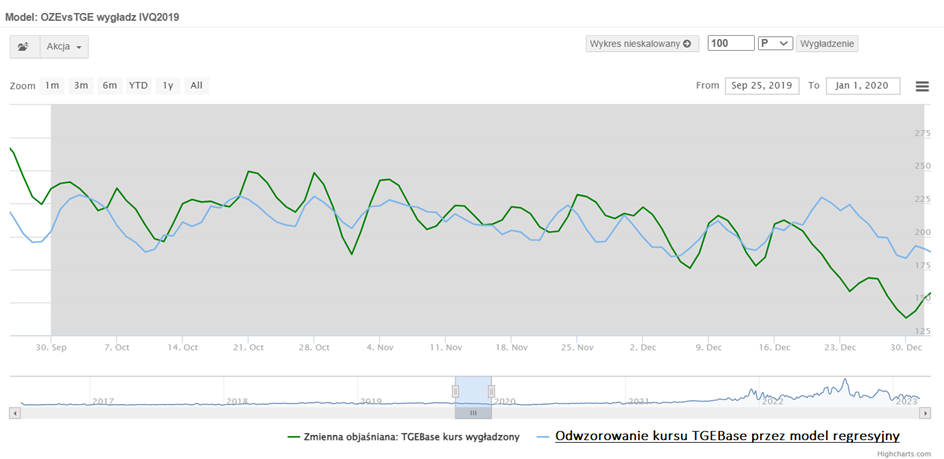
Model response: -0.19744455965498708
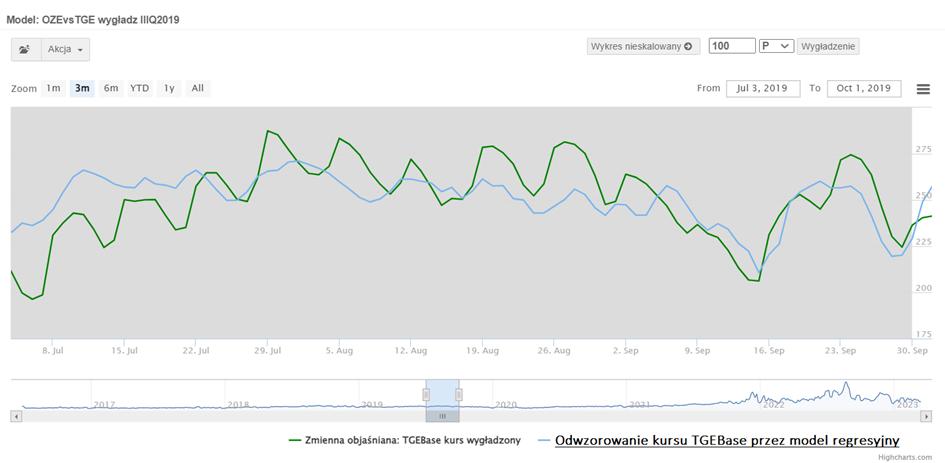
Model response: -0.13726474665212368
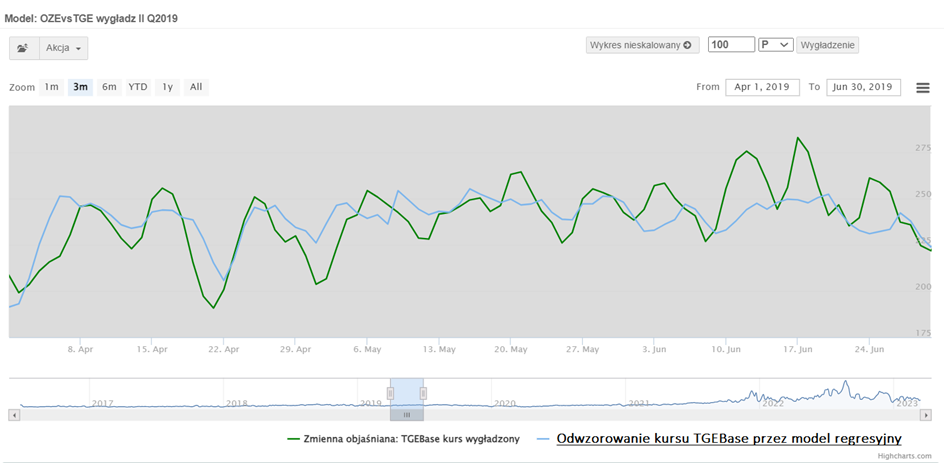
Model response: -0.17804542238114524
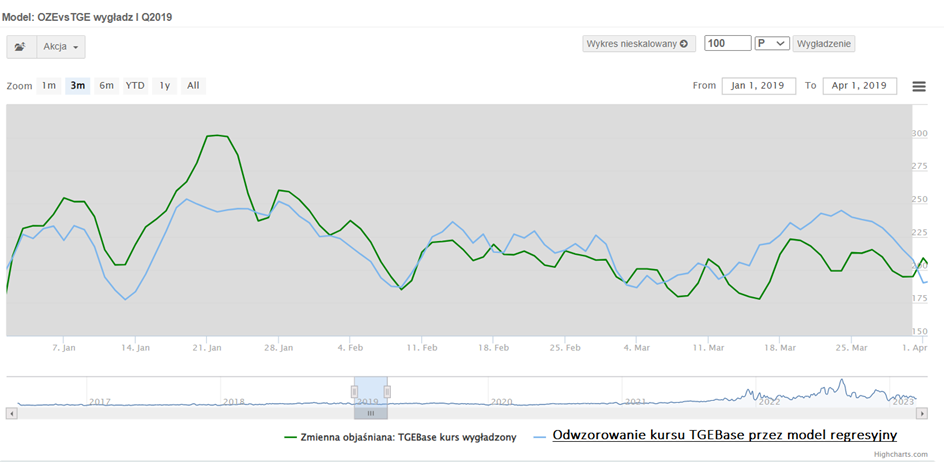
Model response: -0.2789432228064218
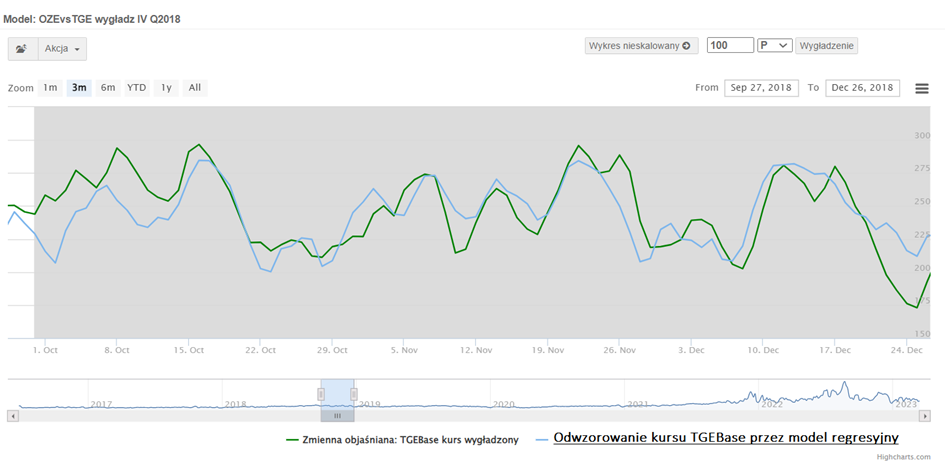
Model response: -0.2584192640427571
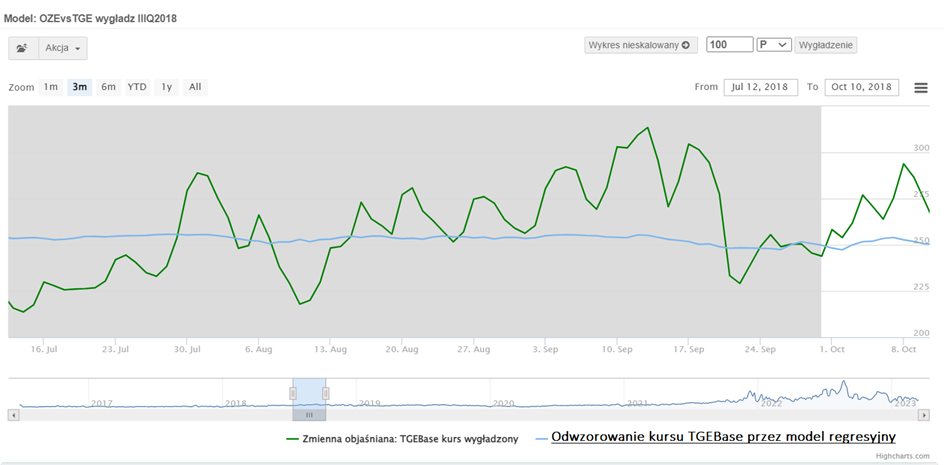
Model response: -0.020236381951115583
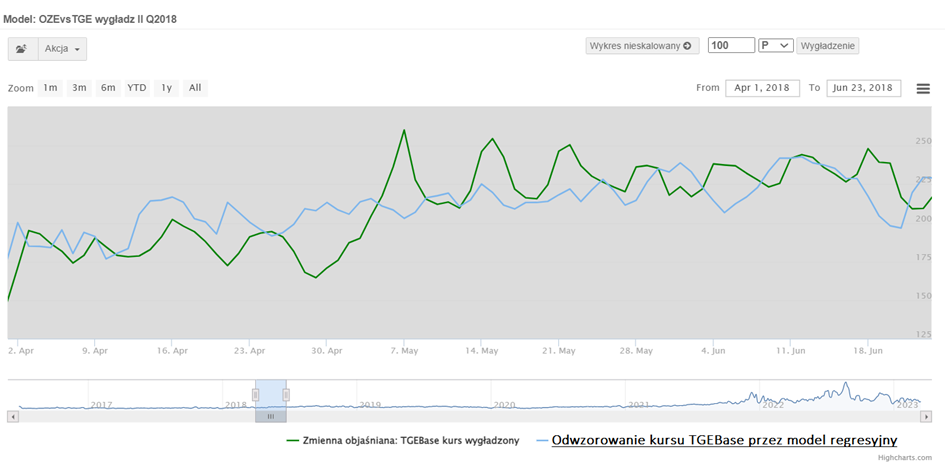
Model response: -0.3186708282148844
Model response: -0.2255402415521714