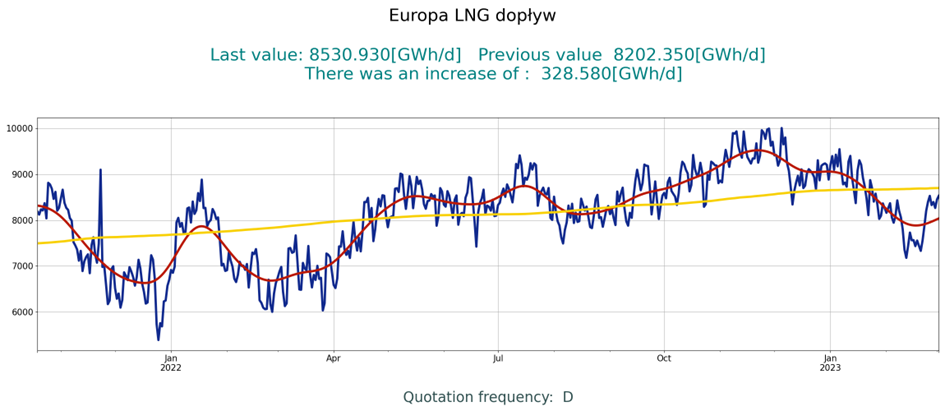
From 05.03.2023 to 16.03.2023, an unusually sharp drop in the supply of LNG to the network of European pipelines and underground storage facilities could be observed. The transport of liquefied gas itself by LNG tankers was not at risk. Instead, there was a problem with unloading and regasification, and the main, but not the only […]
From 05.03.2023 to 16.03.2023, an unusually sharp drop in the supply of LNG to the network of European pipelines and underground storage facilities could be observed. The transport of liquefied gas itself by LNG tankers was not at risk. Instead, there was a problem with unloading and regasification, and the main, but not the only reason for this was the strike situation in France. It coincided at the time with reduced LNG supplies to Spain, Portugal and Italy. As a result, the supply of gas from LNG terminals to the grid decreased by more than 30%:
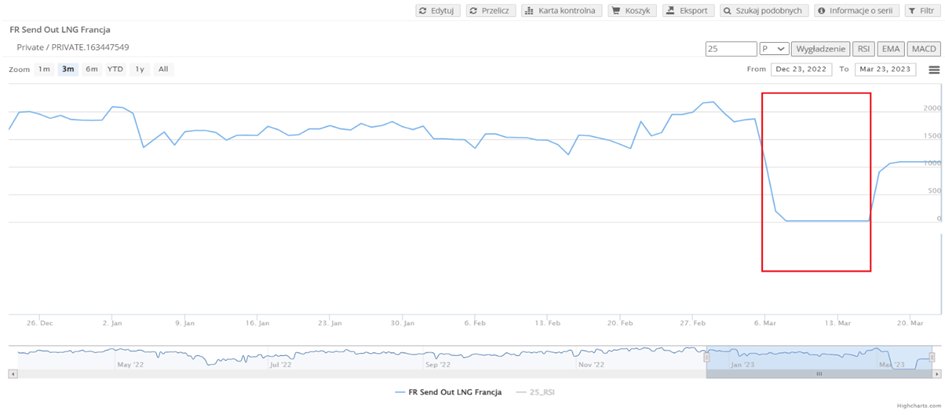
Gas supply to the network in France fell from 06.03 – 16. 03 2023 almost to zero, and stocks at French terminals (before regasification) did not change:

Previously, similar incidents occurred in France in May 2016 and April 2012, but they were characterized by much smaller declines and shorter durations.
The situation in Europe is now returning to normal, and inflows to the network should soon reach pre-downturn levels. In France itself, the process is also underway, but will likely take longer.
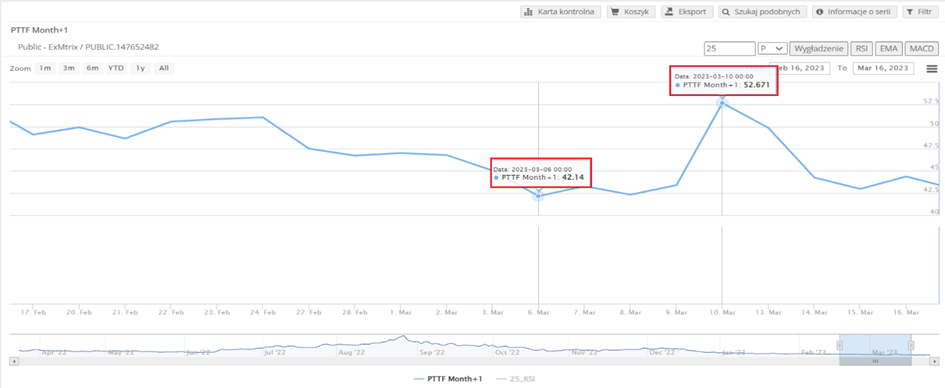
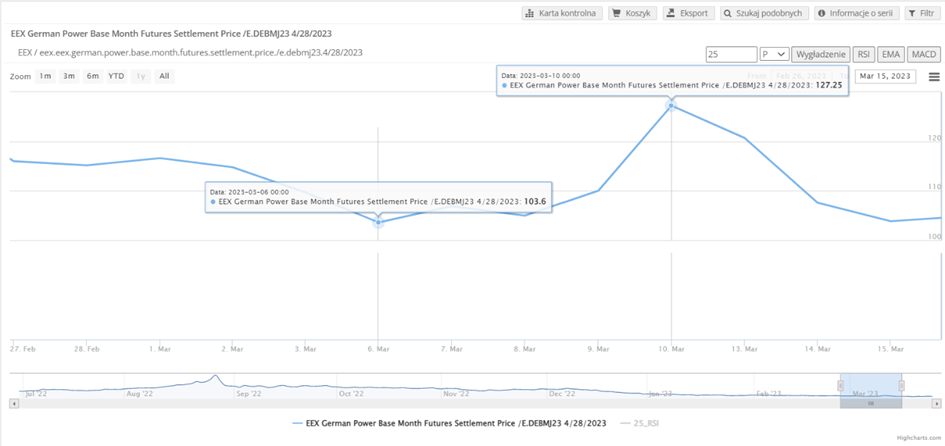
The incident resulted in significant increases in gas prices ( mainly TTF and THE ), as well as electricity prices, for example, in Germany.
The price of the April TTF gas contract rose 24%:
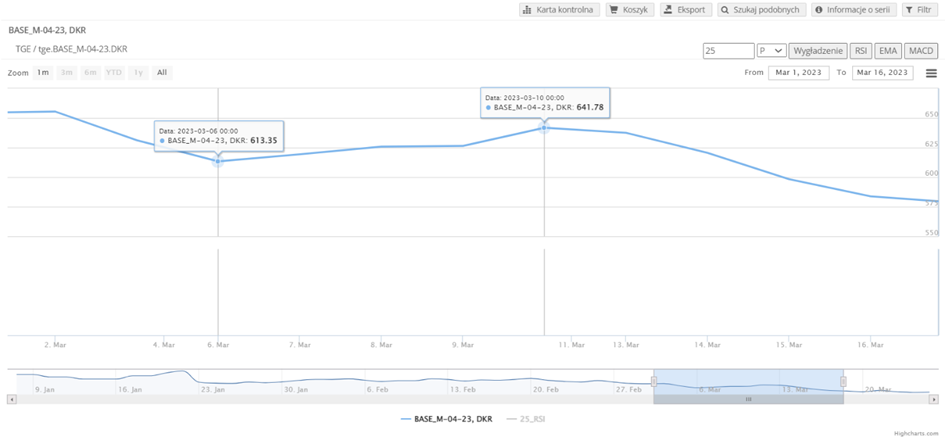
The price of Germany’s April electricity contract rose 22.8%:
The price of the April natural gas contract in Poland rose 18.7%:
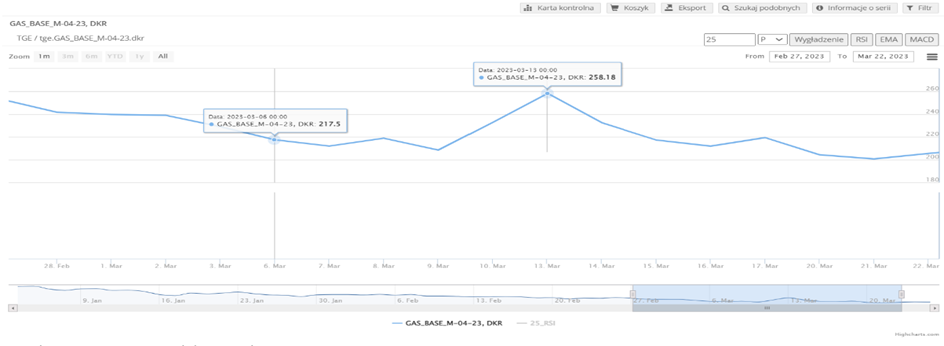
The price of energy in Poland ( April contract) , due to the relatively small share of natural gas in the energy mix and the uninterrupted supply of LNG, increased by only 4.6%:
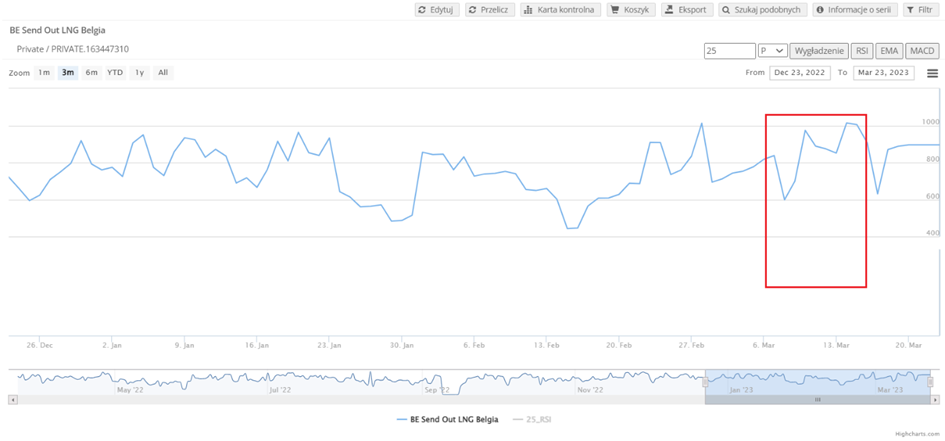
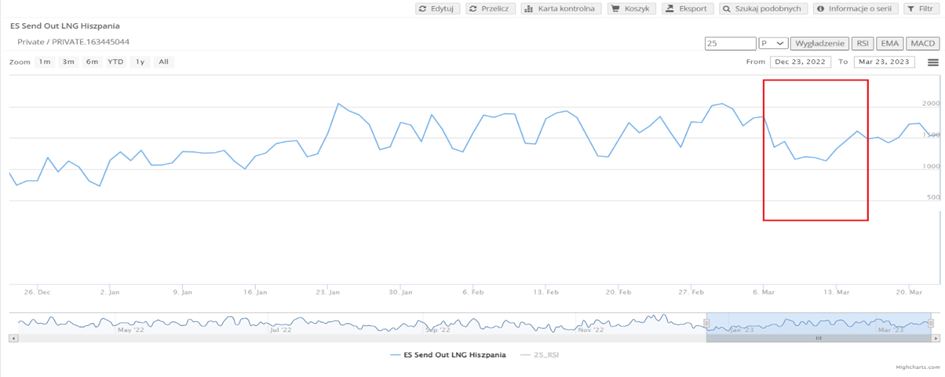
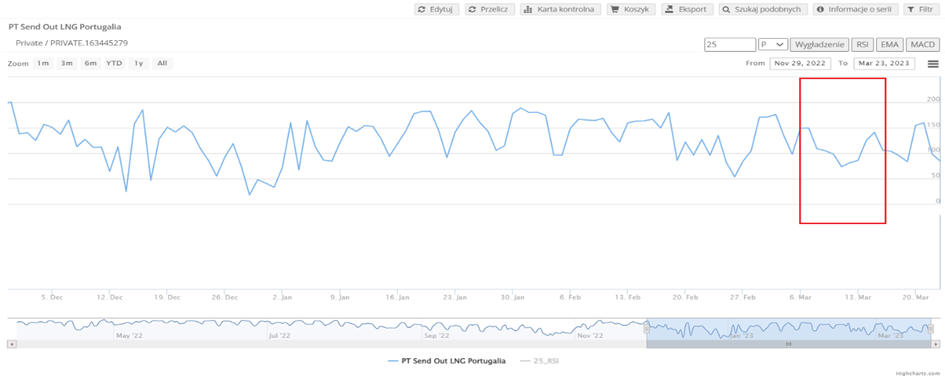
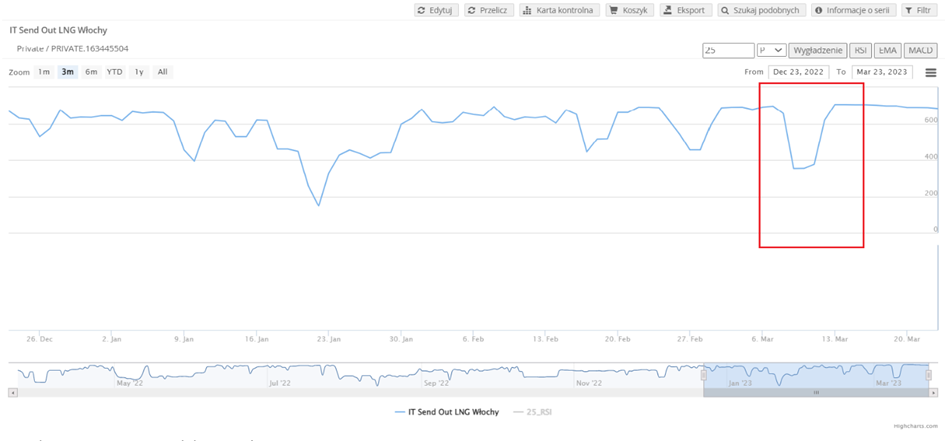
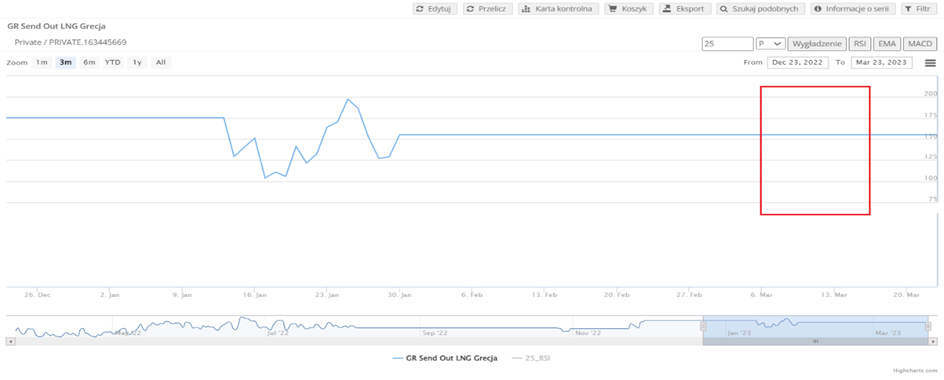
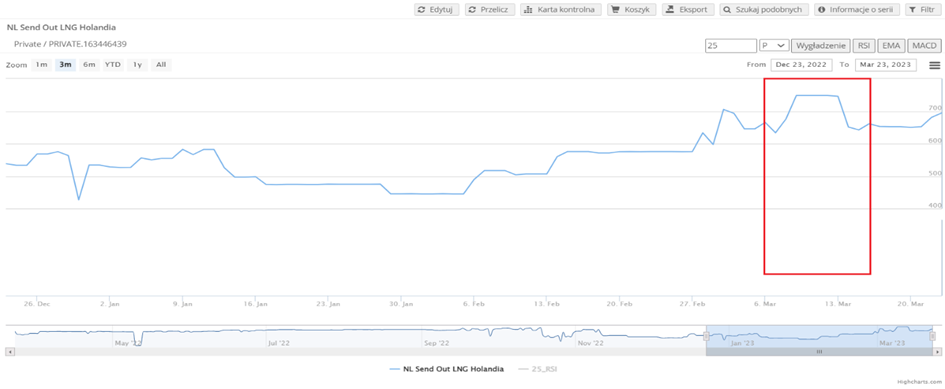
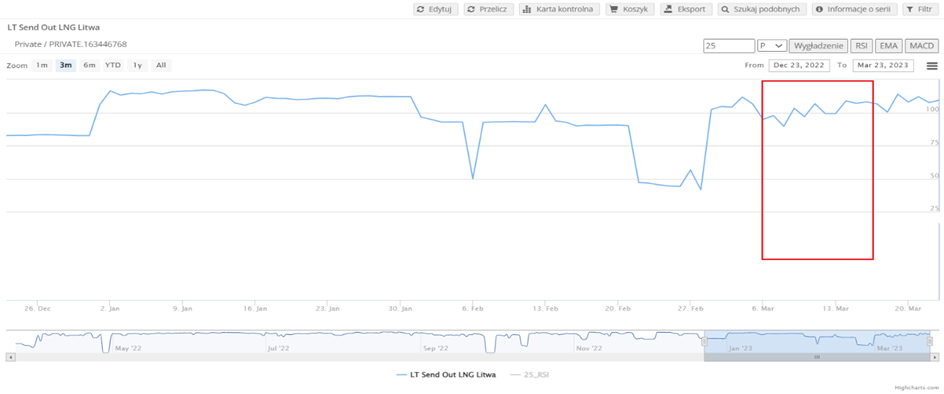
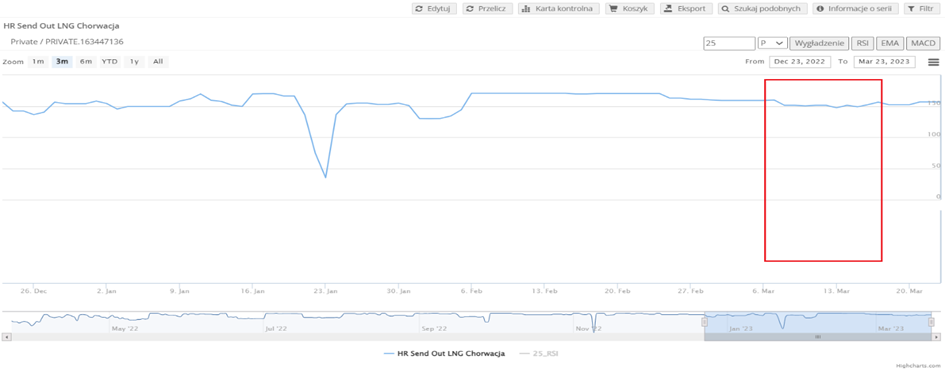
The charts below show the gas inflows from LNG terminals to the grid in each country. It can be seen that France is mainly responsible for the crisis situation, and that the worsening of the problem has been caused by lower LNG supplies to Spain, Portugal and Italy.
France
Spain
Portugal
Italy
Greece
Germany

Netherlands
Poland

Lithuania
Croatia
Belgium