In Q4 2022, a 1[%] increase in the share of generation from RES in the Polish energy mix resulted in a 0.487[%] reduction in energy price, in IQ 2023 – by 0.521[%], and in Q2 2023 – by 0.557[%]. On average, from 2018 to 2023 (Q2), a 1[%] increase in the share of generation from […]
In Q4 2022, a 1[%] increase in the share of generation from RES in the Polish energy mix resulted in a 0.487[%] reduction in energy price, in IQ 2023 – by 0.521[%], and in Q2 2023 – by 0.557[%]. On average, from 2018 to 2023 (Q2), a 1[%] increase in the share of generation from RES in the mix resulted in a 0.243[%] reduction in energy price.
For several years, an increase in the share of RES in the Polish energy mix can be observed. Since mid-2021, this trend has accelerated significantly, and the impact of RES on the price of energy is increasing. The increase in the share of RES in the mix, of course, supports energy price declines. Unfortunately, the share of fossil fuels in the Polish energy mix remains significant. And it sometimes reaches 80 percent. Meanwhile, in Europe, the same fossil resources account for about 30 percent of energy (taking into account nuclear sources, which are lacking in Poland).
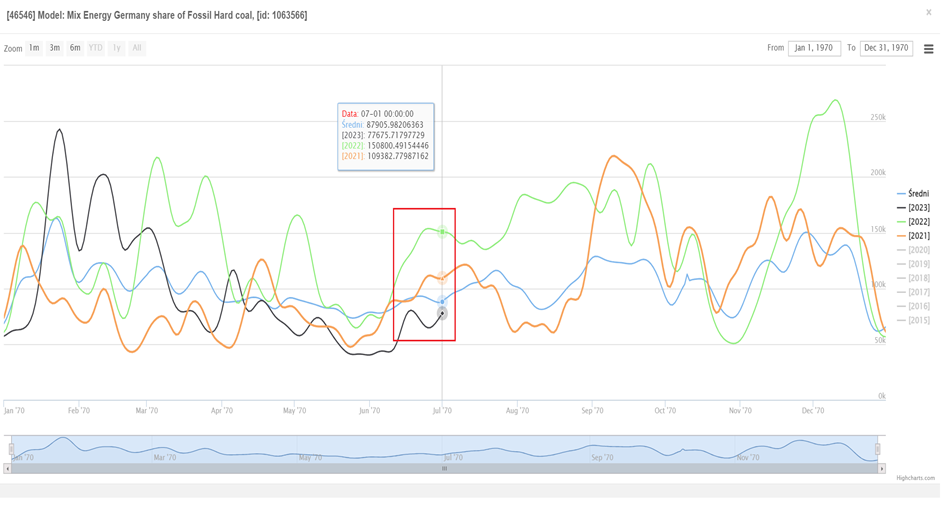
Two EU countries rely most heavily on fossil raw materials (mainly hard coal and lignite) for energy generation. These are Germany and Poland.
In the case of Germany, the share of coal has increased slightly due to the shutdown of the last nuclear units in April 2023.
Still, for example, hard coal has recently been a source of about 7-10 percent of Germany’s energy:
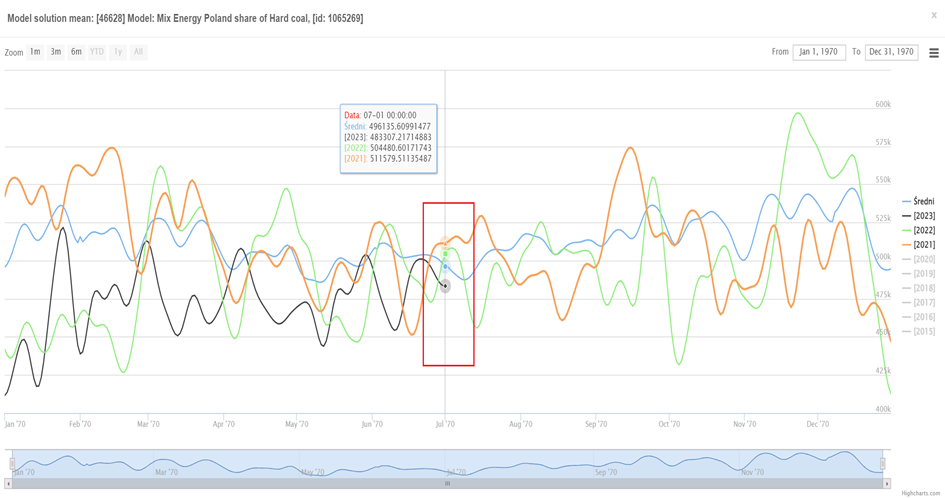
Meanwhile, in Poland, the share of coal-fired power in the mix has recently been 46 to 51 percent:
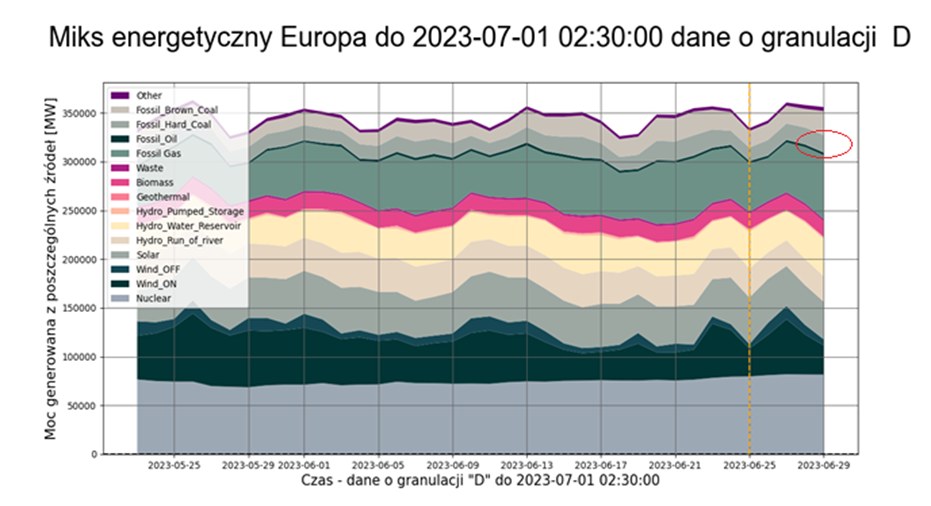
For the EU as a whole, the share of hard coal in the mix, is 5-7 percent:
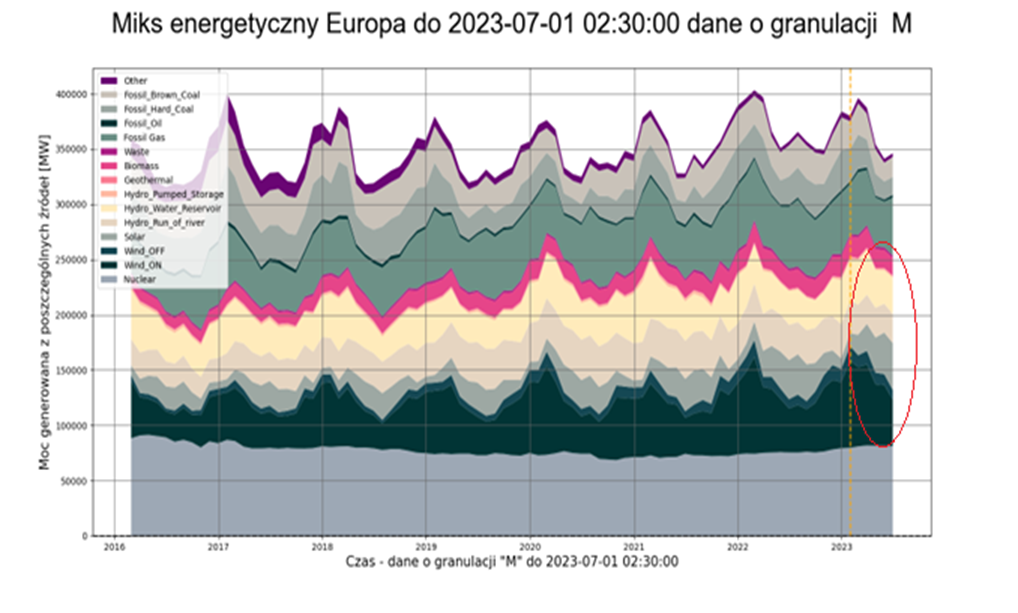
In the EU from 2020 onward, the share of RES in the mix , even after aggregation to monthly intervals and including nuclear sources, often exceeds 50 percent:
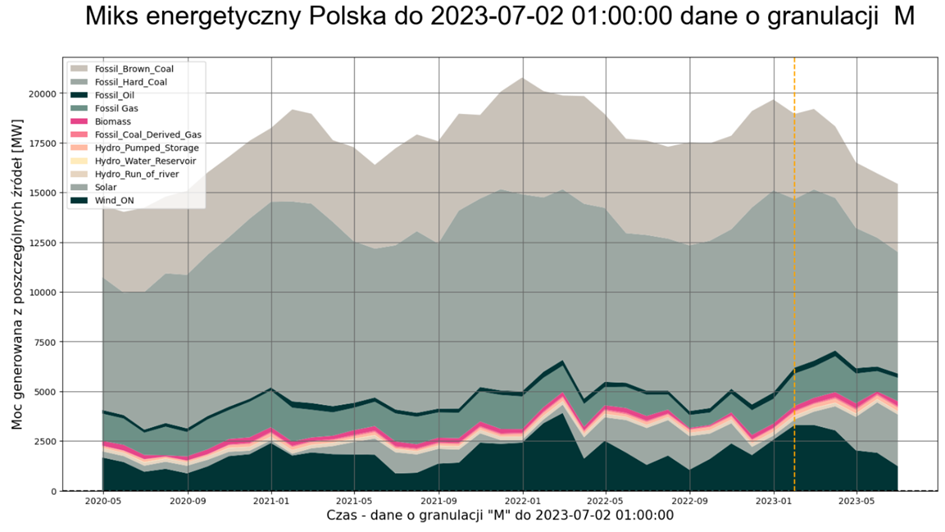
Meanwhile, in Poland, where there is a lack of nuclear sources, this share ranges from 27 to 40 percent:
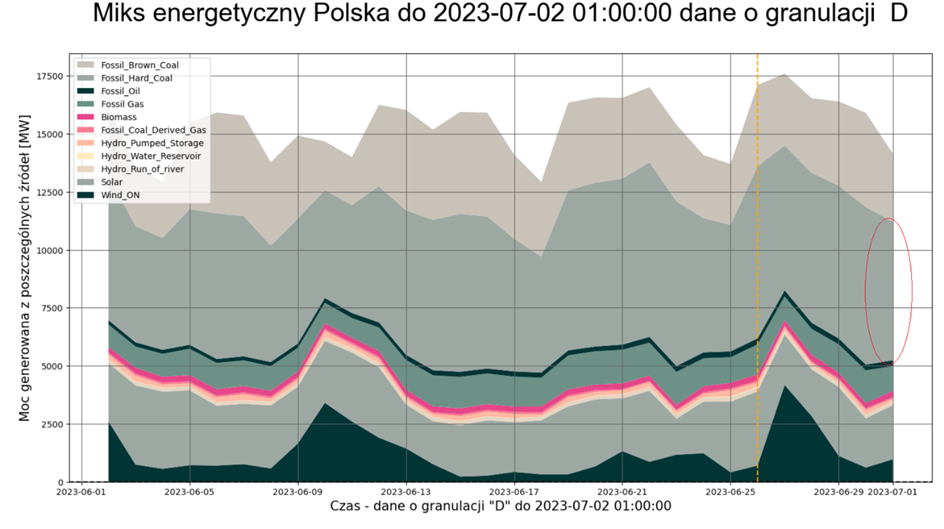
Even so, 2023 still promises to be a record year in Poland in terms of the share of RES, especially photovoltaic sources, in the mix. Until now, never at this time of year has the RES share in the mix been so high:
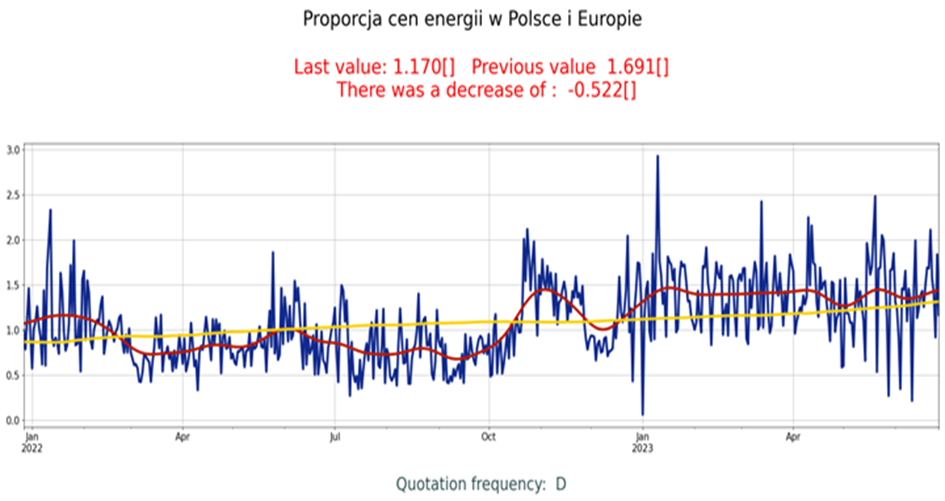
However, this is not enough to effectively compete with the rest of the EU in terms of energy price levels. A mix with a large share of coal results in an energy price in Poland that is on average about 40 percent higher than the average energy price in the EU as of early 2023:
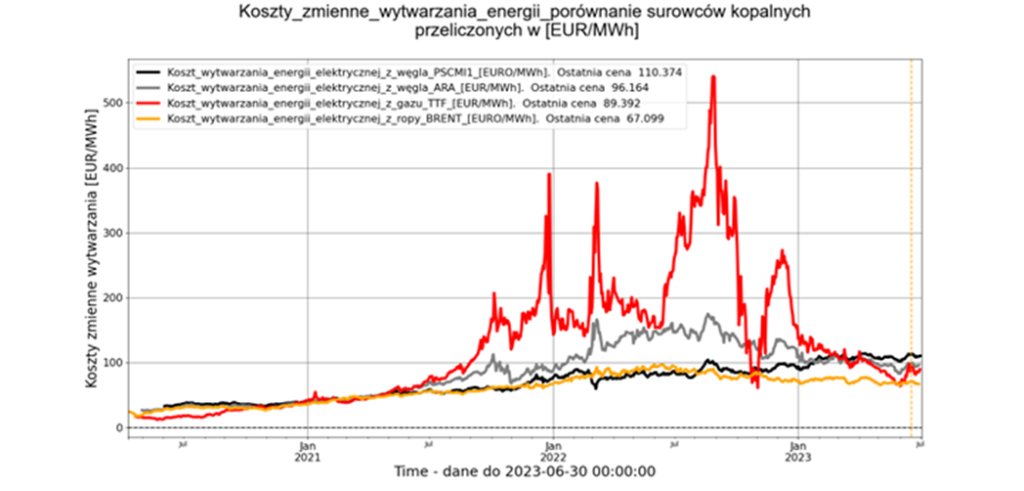
This is, of course, directly related to generation costs, which, due to our energy mix, are currently higher in Poland than average EU generation costs. The main role here is played by the fact that in January 2023 the cost of generation from PSCMI1 pulp became higher than the cost of generation from ARA coal, and then in February 2023 exceeded the level of the cost of generation from gas ( here – TTF gas, but the price of gas on the POLPX in [EUR/MWh] is usually very close to , and most often higher than TTF gas):
In general, the higher the share of RES in the energy mix , the greater its impact on the price of energy:
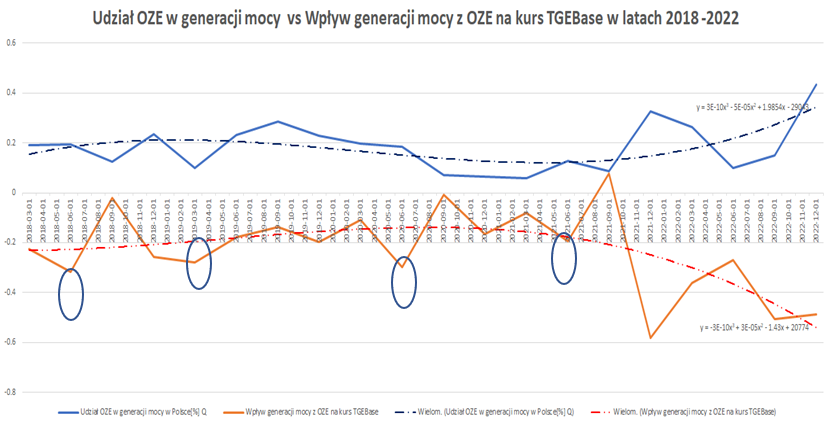
Intuitively, increasing the share of RES in the mix supports declines in electricity prices. This is associated with a reduction in the cost of power generation.
The strength of the relationship between the RES share in the Polish energy mix and the TGEBase price in each quarter of 2018 – 2022 was determined using econometric models on the ExMetrix platform.
Data on RES share in the mix at the end of each quarter in 2018- 2022:
| Date | Share of RES in power generation in Poland *100[%] | Impact of RES power generation on the TGEBase bourse | RES power generation smoothed out | TGEBase course smoothed out |
| 2018-03-31 | 0.191858066 | -0.225540242 | 2948.389467 | 144.7798488 |
| 2018-06-30 | 0.19549446 | -0.318670828 | 1978.349155 | 198.6439156 |
| 2018-09-30 | 0.124099006 | -0.020236382 | 2713.233422 | 243.8668184 |
| 2018-12-31 | 0.234897886 | -0.258419264 | 3890.430656 | 169.6139381 |
| 2019-03-31 | 0.100296196 | -0.278943223 | 3268.868942 | 194.8210269 |
| 2019-06-30 | 0.230405258 | -0.178045422 | 2595.76404 | 221.7712786 |
| 2019-09-30 | 0.286901255 | -0.137264747 | 2691.120143 | 236.3584433 |
| 2019-12-31 | 0.227755736 | -0.19744456 | 3315.937009 | 143.5389847 |
| 2020-03-31 | 0.196757812 | -0.110429925 | 3418.730919 | 140.9425871 |
| 2020-06-30 | 0.183858996 | -0.29727624 | 1806.881886 | 231.9758732 |
| 2020-09-30 | 0.072007076 | -0.007975035 | 2073.395739 | 245.3071397 |
| 2020-12-31 | 0.065954 | -0.166709908 | 1127.29325 | 212.1282877 |
| 2021-03-31 | 0.056978186 | -0.080369107 | 1653.76469 | 237.3864647 |
| 2021-06-30 | 0.126960089 | -0.195039553 | 1486.432388 | 386.2138248 |
| 2021-09-30 | 0.087279988 | 0.07803333 | 2639.536556 | 425.4540631 |
| 2021-12-31 | 0.328036782 | -0.58124956 | 4173.204754 | 443.0652469 |
| 2022-03-31 | 0.262307996 | -0.36088638 | 4800.582689 | 496.1301886 |
| 2022-06-30 | 0.100965647 | -0.269804534 | 2138.302712 | 1132.285331 |
| 2022-09-30 | 0.151268591 | -0.50516867 | 3927.997017 | 546.070845 |
| 2022-12-31 | 0.434441314 | -0.487542396 | 4855.225054 | 484.404742 |
In Q4 2022, a 1[%] increase in the share of generation from RES in the mix resulted in a 0.487542396[%] decrease in the price of energy.
The model response tells how much [%] the TGEBase price will change when the share of RES in the energy mix increases by 1[%].