For listed assets, volumes such as volume or the number of open positions on futures contracts are reported daily in addition to the price. Every week, in turn, detailed reports are published by the Commitments of Traders (COT) on investor structure (a breakdown of the market into investor groups with the number of open long […]
For listed assets, volumes such as volume or the number of open positions on futures contracts are reported daily in addition to the price. Every week, in turn, detailed reports are published by the Commitments of Traders (COT) on investor structure (a breakdown of the market into investor groups with the number of open long and short positions on futures contracts, and in the case of US exchanges supervised by the Commodity Futures Trading Commission – also information to identify investor groups by the size of open positions).
The above-mentioned data allows you to draw additional conclusions about possible market developments.
Below are some examples of market data for four assets listed on US exchanges. Each example separately presents data for large investors. In addition, depending on the structure of investors in a given market – data for a group of mutual funds or for investors in general.
Example one – ethyl alcohol CHICAGO ETHANOL (PLATTS) FUTURES (ICE Futures U.S.).
In this market, the dominant group consists of producers, processors and traders. This group holds about 80% of the futures contracts. Consequently, it actually decides the price. In particular, the market is shaped by the large investors in this group. This can be seen in the chart below. When the balance of open positions among large investors is positive, the price tends to rise, and when the balance is negative, the price falls.

Data source: CFTC , compiled by ExMetrix
The second largest group is investment funds. However, in this market they do not play as significant a role as, for example, in the orange juice market, since it holds only about 16% of the contracts. In this group, the balance of open positions has been exclusively positive for a very long time, yet the price is not rising steadily.
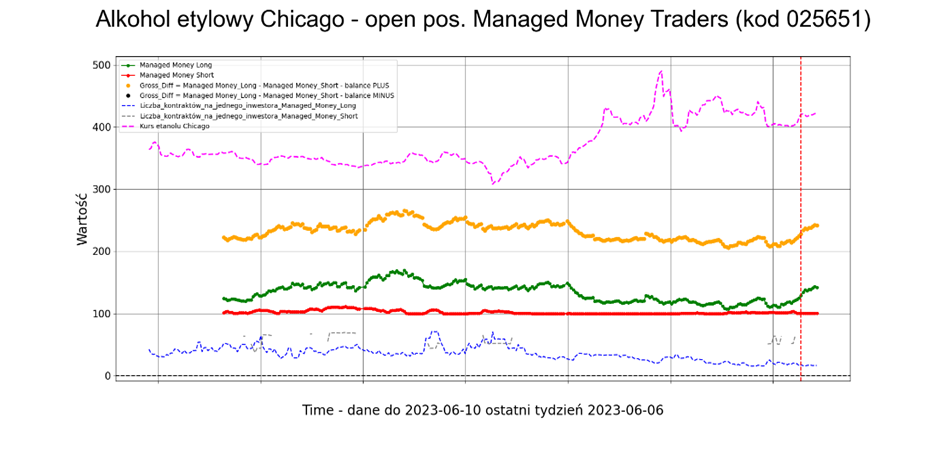
Data source: CFTC , compiled by ExMetrix
Market breakdown by investor group in recent weeks:
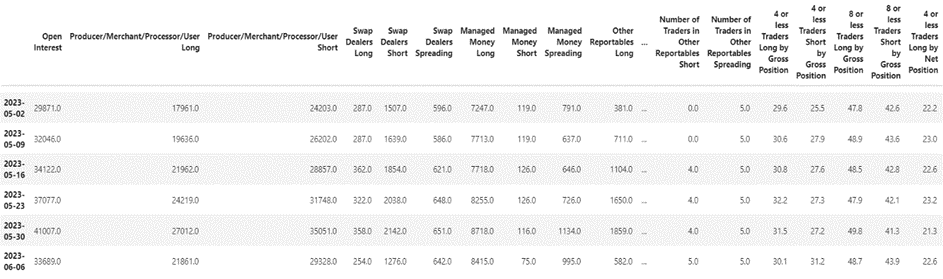
Data source: CFTC , compiled by ExMetrix
Example two – U.S. orange juice (ICE FUTURES U.S.).
In this market, the group of producers, processors and traders is comparable to that of mutual funds in terms of the number of contracts held. When such proportions are present in the market, the more speculatively oriented mutual funds play a dominant role in shaping the price.
In the case of this particular market, large investors show a negative balance all the time, yet the price of orange juice has been rising since 2020.
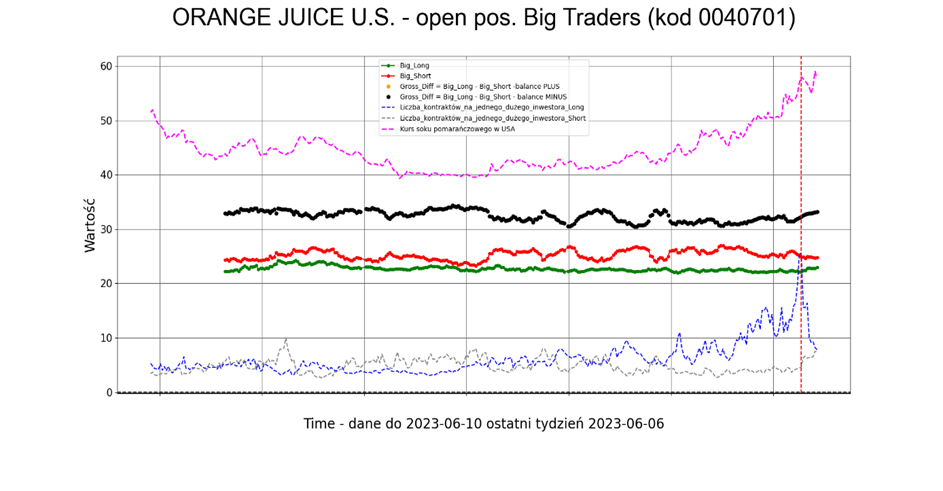
Data source: CFTC , compiled by ExMetrix
Mutual funds are responsible for the rise in the price here, often showing a positive balance of open positions (an advantage of long over short). This situation has been going on continuously for a year and a half:
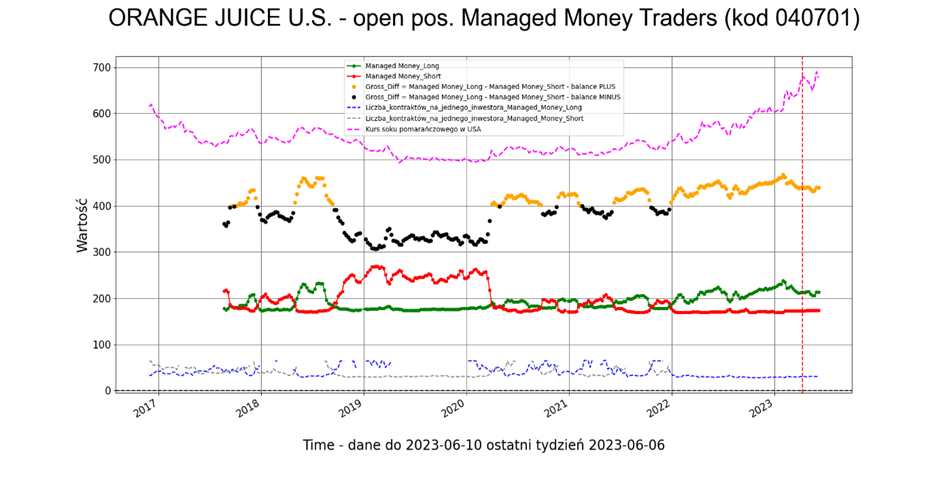
Data source: CFTC , compiled by ExMetrix
Market breakdown by investor group in recent weeks:
Data source: CFTC , compiled by ExMetrix
Third example – Brent oil (ICE FUTURES ENERGY DIV).
The situation in this market differs from the previous ones in that investment funds have no open positions here at all. A group of producers, processors and traders, and in particular a subgroup of large investors, who play a dominant role, are virtually entirely responsible for the formation of the price:

Data source: CFTC , compiled by ExMetrix
The market as a whole is subordinated here to large investors. Despite the fact that smaller investors cause the market as a whole to show a positive balance for many months, the price may be falling, for which the short positions of large investors are responsible.

Data source: CFTC , compiled by ExMetrix
Market breakdown by investor group in recent weeks:

Data source: CFTC , compiled by ExMetrix
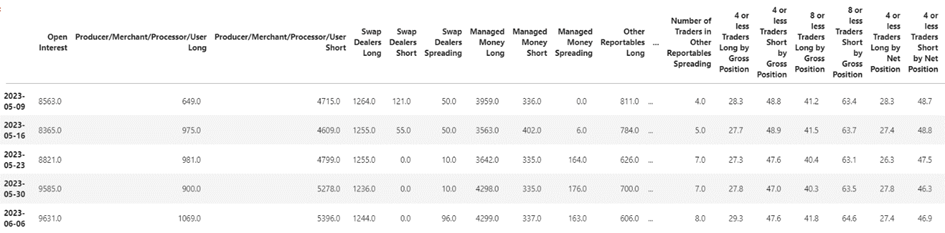
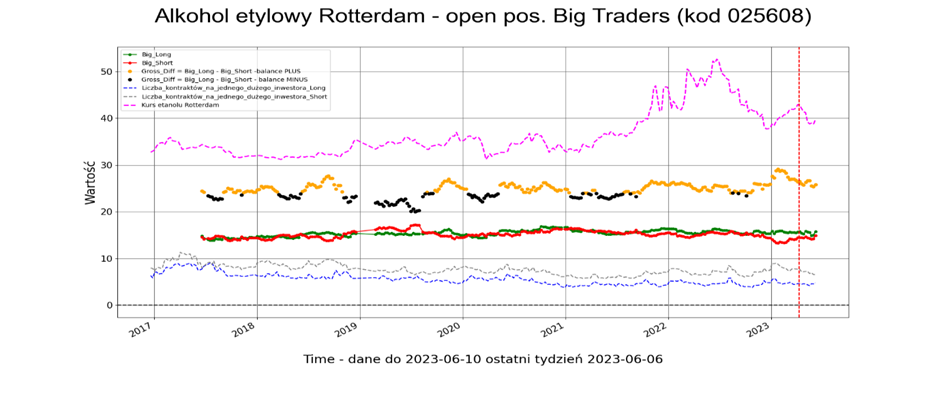
Fourth example – ethanol T2 FOB Rotterdam Barges (Platts) Future (NEW YORK MERCANTILE EXCHANGE).
In this case we have an investor structure almost identical to the previous one (no investment funds in the market).
Data source: CFTC , ExMetrix study
So, the mechanisms shaping the price are similar – the dominance of large investors:

Źródło danych: CFTC , opracowanie ExMetrix
Podział rynku na grupy inwestorów w ostatnich tygodniach:
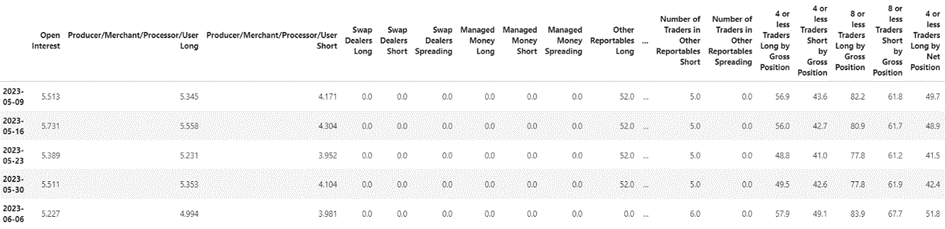
Data source: CFTC , compiled by ExMetrix